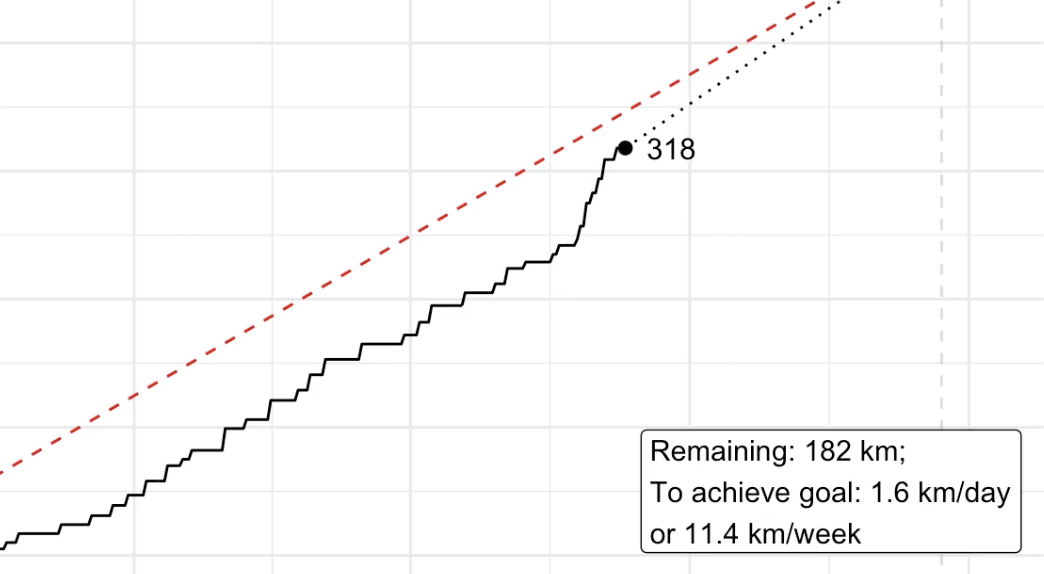
Full disclosure: I did not even have any running goals for 2020. But as it turned out: It has been a good year for running - at least one thing this year was good at. In this post, I want to run you through my R script which creates an animated graph that looks like I had the goal of running 500 kilometres this year (spoiler: I didn’t). This is what the finished graph looks like (for 2020-12-23):
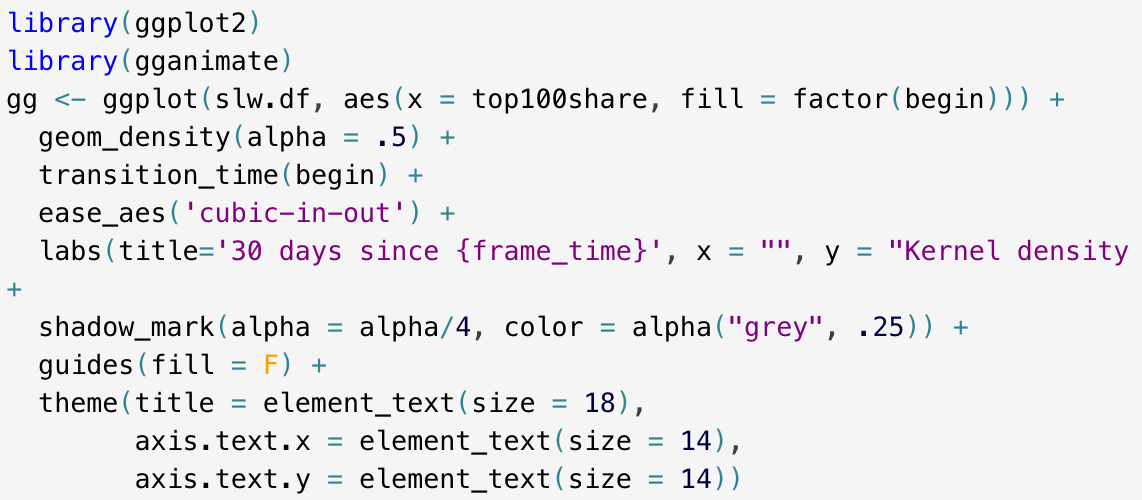
Previously, I’ve plotted a ridgeline based on a variable’s density through time. It might look nice but it’s quite obvious that time can be visualized in a more fitting way - by time itself, in an animated plot that is. So, let’s fire up the {gganimate} package again.
My goal is to show a moving kernel density curve as it moves through time, based on a moving window of 30 days sliding from the past to the present.
Let’s make this a quick and quite basic one. There is this incredibly useful function in R called ifelse(). It’s basically a vectorized version of an if … else control structure every programming language has in one way or the other. ifelse() has, in my view, two major advantages over if … else:
It’s super fast. It’s more convenient to use. The basic idea is that you have a vector of values and whenever you want to test these values against some kind of condition, you want to have a specific value in another vector.
There is a game I play / try to make myself okay / try so hard to make the pieces all fit / smash it apart / just for the f**k of it (Nine Inch Nails: The Big Come Down)
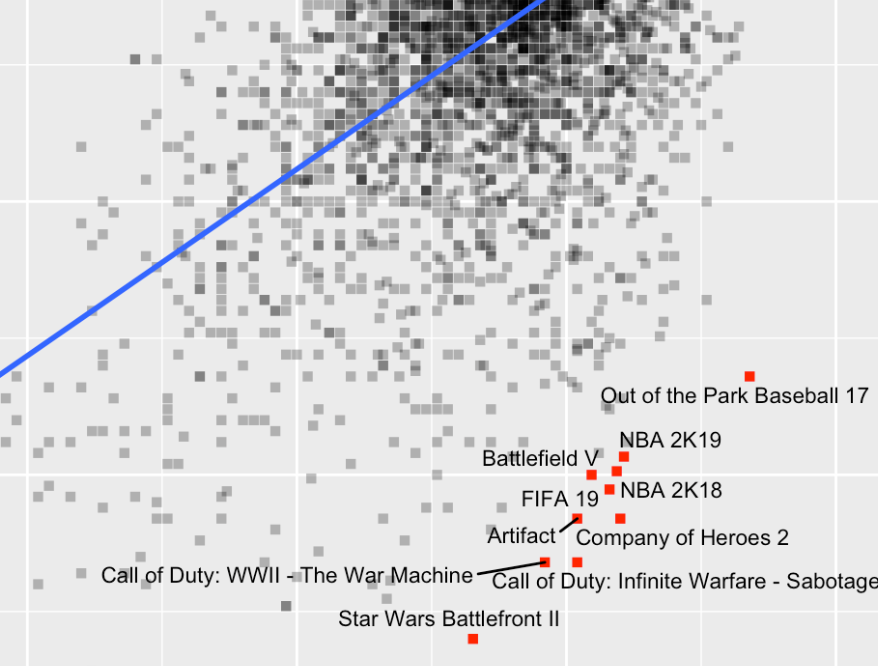
After this rather distressing opening by the Nine Inch Nails, let’s turn to a more uplifting topic: video games! There is a dataset on Kaggle with ratings for over 4000 video games.
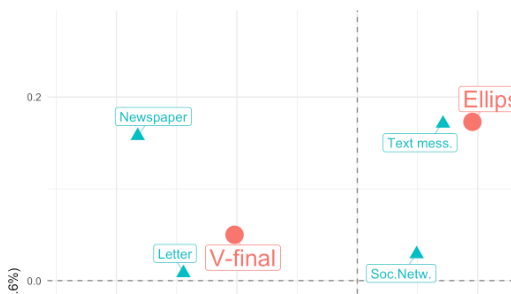
What we want to do Recently, I used a correspondence analysis from the ca package in a paper. All of the figures in the paper were done with ggplot. So, I wanted the visualization for the correspondence analysis to match the style of the other figures. The standard plot method plot.ca() however, produces base graphics plots. So, I had to create the ggplot visualization myself. Actually, I don’t know if there are any packages that take a ca object (created by the ca package) and produce ggplots from it.